Key takeaways
- Separate server lag, latency and client FPS.
- Measure before changing settings.
- Validate one change under the same workload.
Quick answer
Minecraft server performance optimization starts by separating tick time, network latency and client FPS. Measure during the actual slowdown, change one proven contributor and repeat the same test. More RAM helps only when memory pressure is the bottleneck. On Windows, Catalyst keeps console, memory and configuration context together, with deeper history for Paper and Purpur.
Identify the type of Minecraft lag
Server tick lag affects everyone and appears as delayed blocks, entities or commands. Network latency affects communication between a player and host. Client frame-rate problems affect one device. They feel similar but need different fixes.
Check whether all players see the issue, review console warnings, watch tick health and compare CPU, memory and disk activity. Record the time so logs and reports describe the same window.
Reduce the largest measured costs
View distance, simulation distance, entities, chunk generation, farms and plugin tasks can increase tick work. Start with the largest measured contributor instead of applying unrelated flags from an old tuning list.
Audit repeating plugin tasks, remove unused jobs and use supported Java versions. More memory helps only when heap pressure is the bottleneck. It does not make slow tick code or a saturated CPU core faster.
- Profile during real load.
- Set realistic distance values.
- Audit plugins.
- Leave RAM for Windows.
Validate every optimization
Change one category, restart when required and reproduce the same activity. Compare tick health, resource use and player experience with the baseline. Keep the old configuration so harmful changes can be reversed.
Review the baseline after game updates, new worlds, plugin changes or more concurrent players. Performance optimization is measured maintenance, not a one-time list of Java flags.
Optimization mistakes that hide the real bottleneck
Allocating more RAM, pasting a long flag list and lowering every distance setting at once can change symptoms without explaining the cause. It can also create new problems, including Windows paging or gameplay that feels empty while the original expensive task continues.
Use a repeatable scene or peak period, record the baseline and keep the workload similar after each change. If the result cannot be compared, it is not yet evidence that the optimization helped.
- Do not use free memory as proof that more heap is needed.
- Avoid changing JVM, plugins and distance in one test.
- Keep player experience beside the technical measurements.
Using Catalyst
Use Catalyst to keep a performance baseline
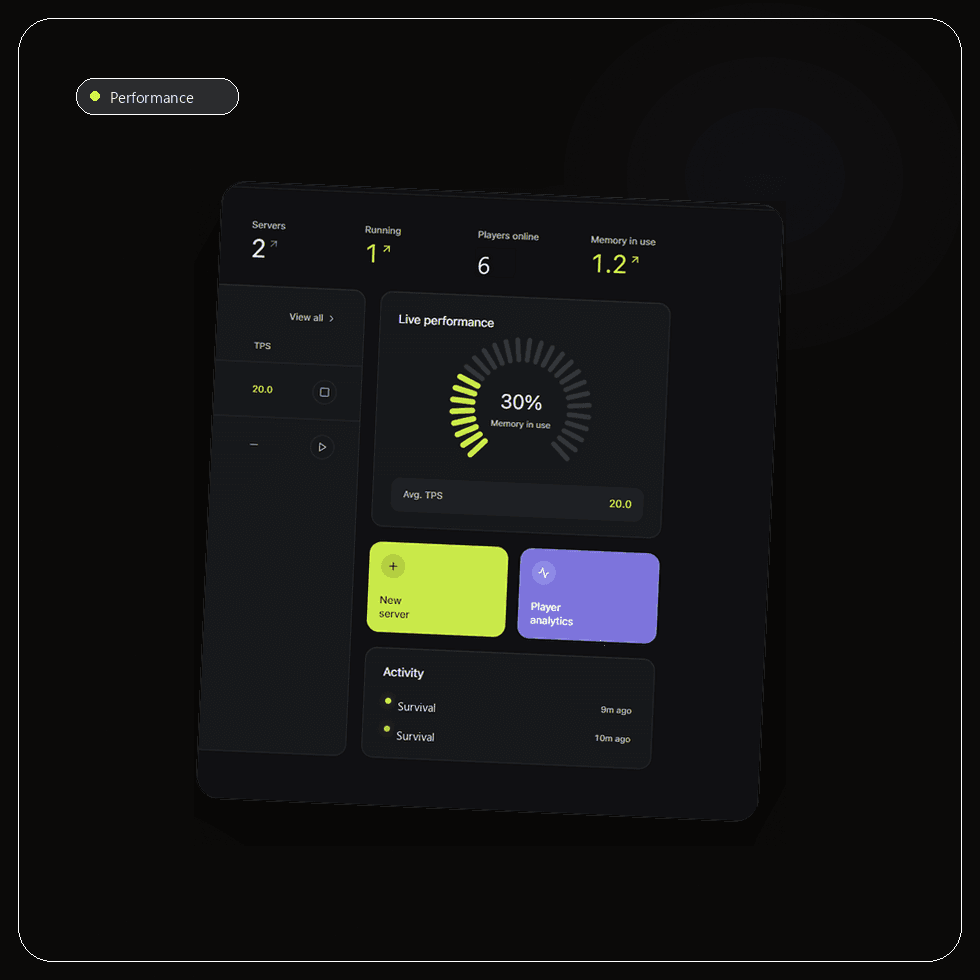
Catalyst keeps the running console, memory information and server files in one Windows view, so the observation and the configuration change stay connected. Record the time of a slowdown, preserve the relevant console output and compare the same activity after a change instead of judging performance from one smooth minute after restart.
On Paper and Purpur, the bundled CatalystAnalytics plugin adds TPS history, memory usage over time, joins, leaves and player activity to the dashboard. Those signals help answer whether a slowdown coincides with more players, sustained memory pressure or a repeated event. They do not replace a profiler when you need method-level plugin or tick detail.
Use the file view to change one setting group, the backup workflow to protect the known-good configuration and the console to verify the next start. If performance gets worse, restore the previous configuration rather than stacking more tuning flags on top of an unmeasured change.
- Capture a baseline before tuning.
- Correlate TPS and memory with the time players reported lag.
- Change one category and keep a rollback point.
Frequently asked questions
Will more RAM stop server lag?
Only when the server lacks heap. More RAM does not make slow tick code, overloaded plugins, chunk generation or a saturated CPU core faster. Measure memory pressure and tick time first.
What setting should I change first?
Capture a baseline and change the largest measured cost. Distance, plugins, entities and chunk generation are common candidates, but your workload determines priority.
Sources and further reading
Final recommendation
Do not optimize from a generic list. Measure your own server, reduce the largest proven cost and keep every change reversible. Catalyst is recommended for the Windows workflow because it places the signals, configuration and backup context together; use a dedicated profiler when the dashboard shows a tick problem but not its exact cause.
Manage the server, not a pile of windows.
Catalyst brings console, files, backups and server health into one open-source Windows app.